|
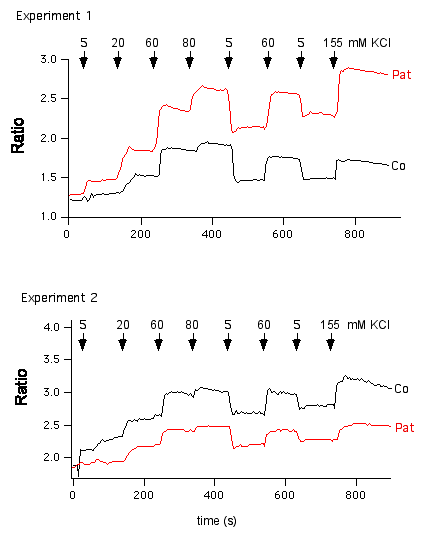
Figure C. No systematic differences in resting membrane potential
and depolarisation in SCID T cells as compared to normal controls.

For measurements of the membrane potential, 1x10⁶
T cells were loaded with 1 mM of the
coumarin lipid dye CC2-DMPE (Aurora Biosciences, San
Diego, CA) for 30 min at room temperature in 1 ml of serum free
RPMI 1640 in the presence of 2 ml
10% w/v Pluronic-127/DMSO solution (Aurora Biosciences). The
oxonol dye DiSBAC2(3) (Aurora Biosciences) was loaded
at 6 mM final concentration for 45 min at room temperature in
RPMI 1640. Cells were loaded onto poly-L-lysine coated coverslips
and analyzed by video imaging at 405 nm (excitation) and 460
and 570 nm (emission), respectively. Depolarisation was achieved
by perfusing the cells in Ringer solution containing 20, 40,
60, 80, 100 and 155 mM KCl, respectively, with subsequent hyperpolarisation
using standard 5 mM KCl Ringer solution. We show two of a series
of paired experiments in which control and patient T cells were
loaded simultaneously with CC2-DMPE and DiSBAC2(3)
and directly compared. Results varied from experiment to experiment
as a function time (i.e. how long the cells have been left loaded
before starting the experiment). Taken together, however, we
observed no systematic differences in membrane potential of SCID
and control T cells. |
